 ™
™A Quarter of ICE Arrests of Asian Immigrants Happen in California. The Share Was an Eighth.
California's count rose 967% against a national 436%. By the tracker's own population test, the state still isn't an outlier.
Stop AAPI Hate published a tracker on September 15 that counts ICE arrests, detentions and deportations of people from Asian and Pacific Islander countries, built from records the Deportation Data Project pried out of the agency under FOIA. LAist reported the top line Sunday morning: California accounts for one in four ICE arrests of Asian immigrants. The tracker publishes its own record-level file, so we pulled it and re-ran the counts. It gives the organization's numbers back: 21,078 arrests of people from Asian countries between January 20, 2025 and August 6, 2026, of which 5,303 — 25.2% — happened in California.
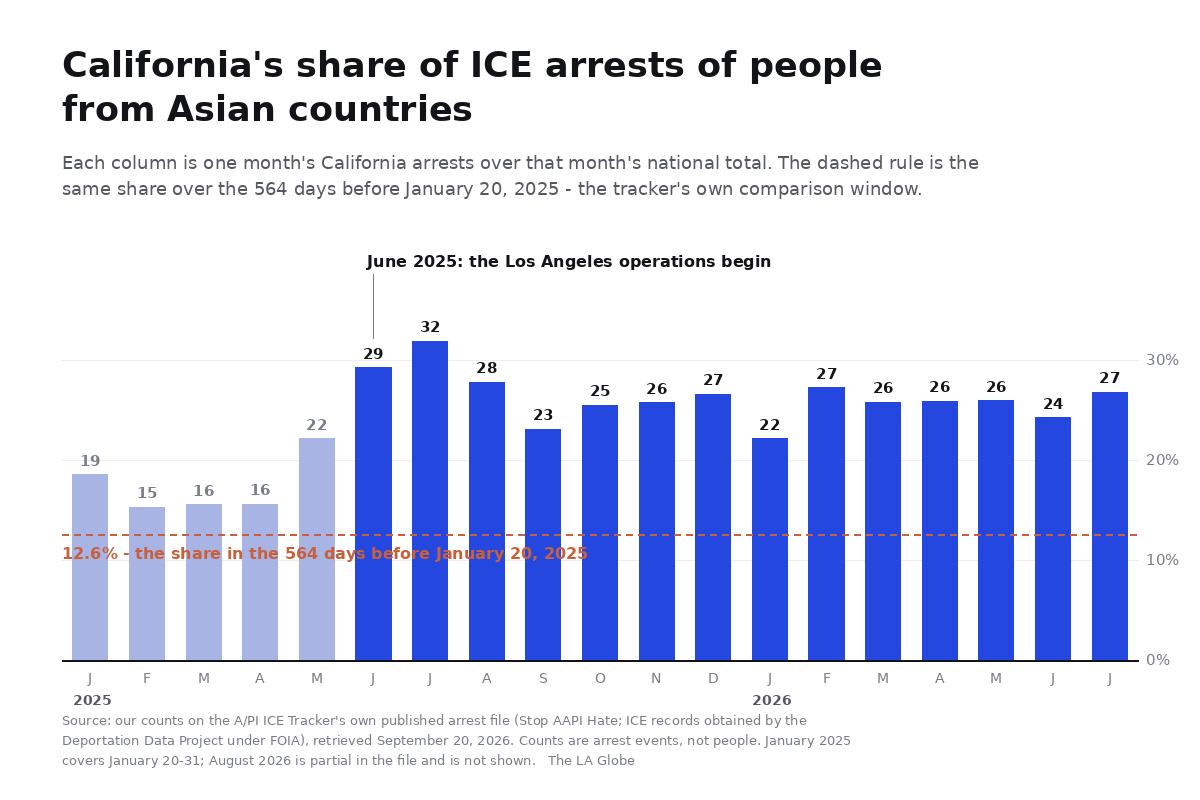
It also holds a second number, which nobody put in a headline. In the equivalent stretch before January 20, 2025, California's share was 12.6%.
The state didn't move. The share did.
As quoted / in context
As quoted. "California accounts for 1 in 4 ICE arrests of Asian immigrants, new tracker finds," LAist's headline reads. Stop AAPI Hate's own findings post puts California first among "the top 5 locations for Asian arrests," at 25% of them, ahead of Texas at 13% and New York at 9%. In the group's launch announcement, research director Stephanie Chan says Asian communities are "too often left out of national conversations about Trump's anti-immigrant agenda."
In context. The tracker's method, stated on its About page, compares the current administration against an equal-length window ending January 19, 2025. Rebuild that window on the file and it returns the published figure: 3,936 arrests of people from Asian countries, against 21,078 now, a rise of 435.5% where the organization prints 436%. California's slice of the earlier window was 497 arrests. Of the later one, 5,303. That's a rise of 967% inside a national rise of 436%, which itself sits inside an overall ICE arrest rise of 219%.
Three rates, three sizes, one direction. California is the steepest of them.
The month-by-month file says when. From January through April 2025, California held between 15.3% and 18.5% of the country's Asian arrests. In May it was 22.1%. In June — the month federal agents began the Los Angeles operations, on the 6th, at a Westlake Home Depot and a downtown apparel warehouse — it was 29.2%. In July 2025 it was 31.9%. It has not gone back below 22% in any month since. The share didn't spike and settle. It spiked and stayed.
What the quarter is divided by
By people, California is bigger than a quarter of Asian America. Pew Research Center puts 29% of the nation's Asian population in this state — about 7.2 million of 24.8 million as of 2023 — and 2.45 million of them in the Los Angeles–Long Beach–Anaheim metro, a concentration second only to New York's.
Stop AAPI Hate runs that comparison itself, and on a tighter denominator than Pew's: each state's share of the Asian-born noncitizen population, from the Census Bureau's 2020–2024 American Community Survey. Among the top 15 states for Asian arrests, the ones it flags as out of proportion are Oklahoma — over nine times its population share, which the group attributes to joint highway-patrol and ICE operations aimed at commercial truck drivers — along with Indiana, Minnesota and Pennsylvania at roughly twice theirs.
California is not on that list. The state leads the country on volume. It does not lead on rate, and the difference between those two sentences is the whole column.
What it excludes
- Race, which ICE doesn't reliably record. The tracker identifies A/PI records through ICE's "citizenship country" field, because the agency doesn't consistently release race data or collect detailed A/PI ethnicity at all. So no U.S.-born or naturalized Asian American appears in this file, and a Nepali-speaking Bhutanese refugee whom Bhutan refuses to recognize is still filed as Bhutanese. Stop AAPI Hate says as much, and declines to use ICE's word "citizen" for that reason.
- People. The counts are actions, not human beings. One person arrested twice is two arrests, and one person detained across three facilities is one stay with three lines under it. Every figure on this page is an event count.
- Los Angeles. The arrest file records a state and nothing smaller. There is no county in it, no city, no neighborhood, which means the tracker cannot answer the first question an Angeleno would ask it. Separately, LAist's own analysis of Deportation Data Project records counted more than 14,000 federal immigration arrests in the greater Los Angeles area in 2025, across all nationalities, most of them people with no criminal record.
- Exact ages. ICE records a birth year and not a birth date, so every age in this data is a subtraction, including ours.
- Everything after August 6, 2026. FOIA releases lag, and the file ends where the last release ended. Eleven people from Asian countries died in ICE custody inside the window. A twelfth, a Chinese man, died on August 23 — after the data stops, and before it was published.
The number underneath
The composition of a California arrest changed more than its odds. In the earlier window, the most-arrested nationality in this state was Vietnamese, 185 arrests, followed by Chinese at 92 and Indian at 68. In the current one, Indian nationals account for 2,060 California arrests — 38.8% of the state's total — followed by Chinese at 1,536, Vietnamese at 708 and Laotian at 233.
Run those against the national counts and California's pull is specific rather than general. The state holds 33.7% of every U.S. arrest of an Indian national, 32.8% of Vietnamese, 32.0% of Filipino and 29.1% of Chinese. It holds 3.3% of Uzbek arrests. The enforcement that has fallen hardest on Central Asian communities, by the tracker's own disproportionality math, is happening along interstates in Oklahoma, not off the 10.
The people arrested in California are 84.7% male, median age 37 at arrest. That median sits between two different populations. The median Indian national arrested in this state was 28 years old; 3% were 50 or older. The median Vietnamese national was 52, and 63% were 50 or older. Laotian, 49. Cambodian, 48. Stop AAPI Hate's account of the Southeast Asian figures is that they are refugee communities resettled after the Vietnam War and the wars around it, some of them — per the Southeast Asia Resource Action Center and the Southeast Asian Freedom Network, cited in the group's findings post — arrested at routine immigration check-ins they had kept for years without incident.
Then there is the part of the file with an address. Counting by unique detention stay, 18,769 Asian detentions were booked nationally inside the window, and 4,205 of them followed an arrest in California. Of those 4,205, a quarter again — 1,059 — passed through at least one facility outside the state: Texas 663, Arizona 556, Louisiana 369. Inside California, the most frequent entry attached to a California arrest is an administrative code the data doesn't define, "LOS CUST CASE," logged to Los Angeles County, 1,439 stays. The largest named building is the Adelanto ICE Processing Center in San Bernardino County, at 1,354.
The verdict
One in four is correct, and it is the least surprising number in the file. California is about a quarter of this because California is nearly a third of Asian America; the tracker's own population test declines to call the state an outlier, and it calls four other states exactly that.
The numbers that moved are the ones underneath. A state share that went from 12.6% to 25.2% in nineteen months. A count that rose 967% while the national Asian count rose 436% and all ICE arrests rose 219%. A top nationality that changed from Vietnamese to Indian. And 1,059 detentions that began with an arrest in California and continued in Texas, Arizona or Louisiana.
Divide responsibly.
How we counted
We downloaded the A/PI ICE Tracker's published arrest and detention files on September 20, 2026, and reproduced Stop AAPI Hate's own totals before computing anything new: 21,078 Asian arrests and 18,769 Asian detentions in the January 20, 2025–August 6, 2026 window, a July 2026 monthly peak of 1,950, and a 25.2% California share. Comparisons to the previous administration use the tracker's stated method, an equal-length window ending January 19, 2025. Detentions are counted by unique stay rather than by file row, because a single stay spans multiple facility lines; counting rows would have tripled the number. We did not contact Stop AAPI Hate; every figure here is either published by the organization or computed from the file it publishes.
Sources: apiicetracker.org/arrests, stopaapihate.org, laist.com, pewresearch.org, deportationdata.org, retrieved September 20, 2026.
Comments 0