 ™
™Crime Fell in 18 of L.A.'s 21 Police Divisions, but Not Downtown
Theft is the one category that didn't fall citywide, and it rose fastest in the three divisions where crime went up.
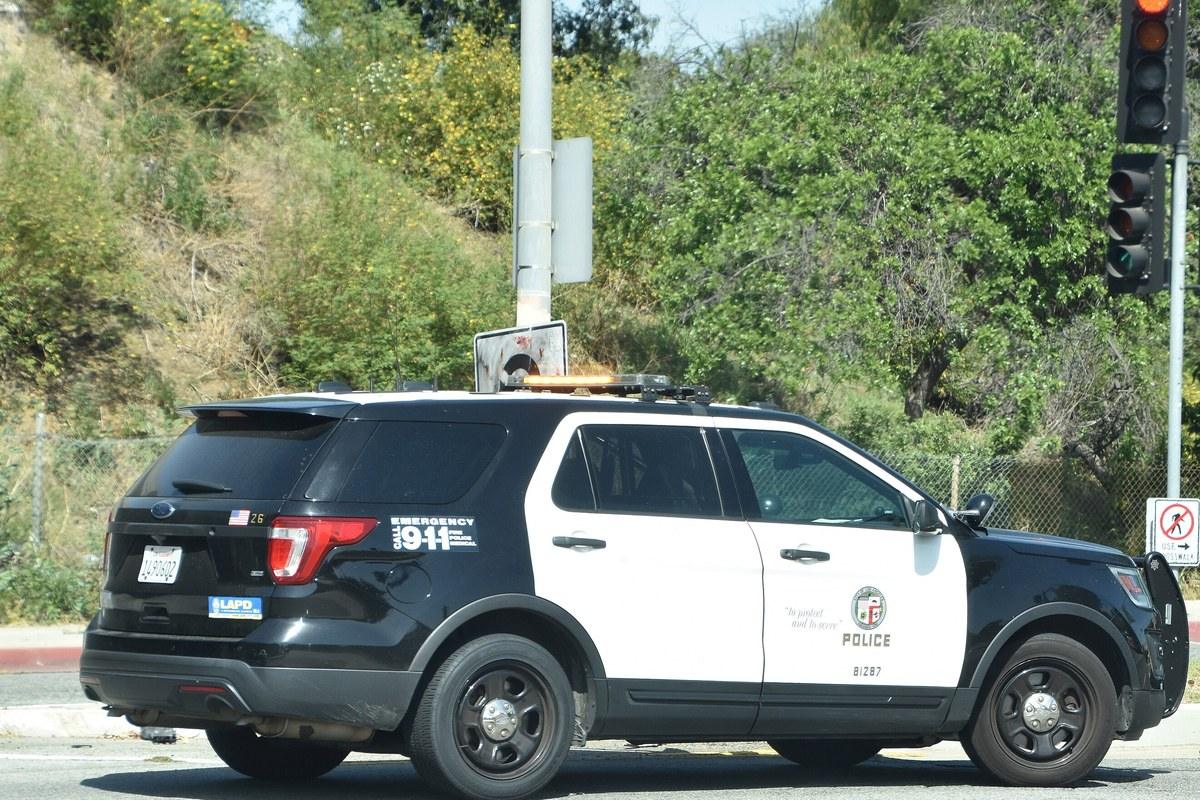
Eighteen of the Los Angeles Police Department's 21 patrol divisions have logged less crime this year than last. Downtown is one of the three that haven't. We pulled all 21 of the COMPSTAT area profiles the department posts, each current through Sept. 19 and prepared Sept. 22, and added them up: 73,244 offenses against 80,886 at the same point a year earlier. The 21 sheets sum exactly to the department's own citywide profile, which is how we know nothing fell out of the pile.
That's a 9.4 percent drop, and it's broad: 13 divisions are down by double digits. Van Nuys is off 22.4 percent, Harbor 21.8, Wilshire and Hollenbeck 18.5 apiece. The three going the other way are Newton, up 11.4 percent; Central, up 2.0; and Rampart, up 0.8.
Those three are worth placing. Central Area covers downtown's four and a half square miles — Chinatown, Little Tokyo, the Historic Core, Central City East, the Fashion District — and the department counts 90,000 residents inside it plus roughly 200,000 people a day who don't live there, by its own description of the Area. Newton sits just south, station at 3400 S. Central Ave., with the Fashion District, Pueblo del Rio and South Park on its list of communities served. Rampart is Westlake, Pico-Union, MacArthur Park, Historic Filipinotown and Echo Park, per the same source.
Seven categories fell. The eighth didn't move.
The citywide sheet splits the total into eight offense groups, and seven of them are down: burglary 26.3 percent, motor-vehicle theft 21.4, homicide 18.4, theft from a vehicle 8.3, rape 7.2, robbery 4.4, aggravated assault 3.9. Larceny — the catch-all that holds shoplifting, pocket-picking, theft from a building and whatever the department files under “all other larceny” — came in at 22,271 offenses against 22,264. Seven more, across 473 square miles.
That flat line does more work than it looks like. Larceny is the largest single category on the sheet, bigger than car theft and burglary put together, so when it holds still while everything around it drops, it's what decides where a division's total lands.
Sort by theft and the same three come up first
Rank all 21 divisions by their larceny change and the top of the list reads Newton, up 35.6 percent; Central, up 29.6; Rampart, up 27.1. Those are the same three divisions where total crime rose, in the same order. Fourth place is Southeast at 11.1 percent, sixteen points back.
In raw offenses, Central added 471 larcenies, Newton 235 and Rampart 206. Ten divisions added some, eleven shed them, and the whole city nets out at plus seven. Pacific by itself dropped 305.
Rampart is the cleanest illustration of what that does to a total. Its burglaries, car thefts and thefts from vehicles all fell — 188 fewer offenses between the three — and its property crime still finished up, by 18, because larceny added 206. Take larceny out and Rampart reads like the rest of Los Angeles.
Central is a different animal. Its property crime barely moved, up 32 on the year, with a 274-offense collapse in thefts from vehicles absorbing most of the larceny jump. Downtown's increase is mostly on the person side: aggravated assaults from 1,022 to 1,092, robberies from 476 to 501. Central also carries by far the biggest raw volume in the city, 6,377 offenses, about 2,000 more than any other division.
Newton is the only one of the three that's up on everything. Property crime 14.4 percent, person crime 5.5 percent, and all four property categories — burglary, car theft, theft from a vehicle, larceny — higher than last year.
Where it fell hardest
Van Nuys posted the largest decline in the city, and it's a property story: burglaries down 40 percent, from 530 to 318; car thefts down 34.5 percent; thefts from vehicles down 30.4. Harbor recorded 336 fewer car thefts than last year, the biggest drop in that category anywhere in the department. Devonshire logged 338 fewer burglaries, a 52.6 percent fall and the steepest of any division, while cutting its overall crime 17.2 percent.
The homicide line, and what it isn't
The sheet's homicide row reads 204 through Sept. 19, against 250 a year earlier. It isn't a murder count. The profile's own legend puts two federal offense codes in that row — murder and nonnegligent manslaughter, and negligent manslaughter — so it counts more than murders do, and it shouldn't be set beside the homicide tallies City Hall quotes.
At division level those figures swing hard, because they're small. Devonshire went from 3 to 10 and Van Nuys from 4 to 10 while both cut total crime by roughly a fifth. Harbor went the other way, 8 to 3. 77th Street still carries the most of any division, 29, down from 41. One incident moves a percentage by double digits at those counts.
Every profile carries the same line at the bottom: preliminary, subject to further analysis and revision. Each one also lives at a fixed address, so next week's report lands on top of this week's at the same link and this week's is gone. Your own division's sheet is on LAPD's crime-mapping page, filed under the station's name.
Comments 0