 ™
™Metro Says June Surged and May Slipped. June Had 701,177 Fewer Rides.
Rail ridership grew 1.4% between the two months. Its published year-over-year growth rate went from 9.5% to 21.8%. Almost nothing changed on the trains; what changed was the month underneath the percentage.
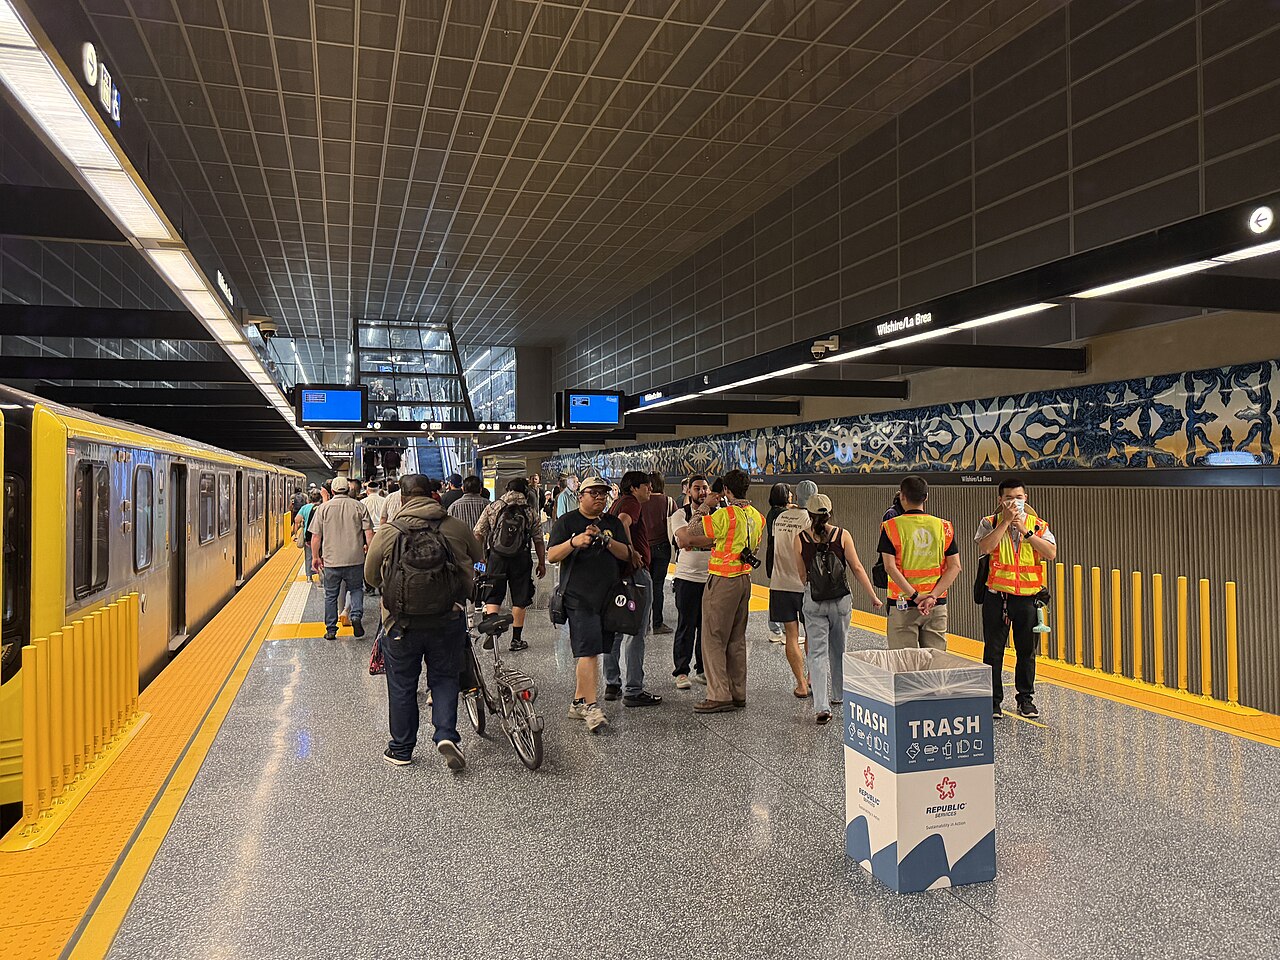
Metro published two monthly ridership releases a month apart. The first, on June 15, ran under the headline "Metro D Line Expansion Helps Drive Rail Ridership to Highest Numbers in More Than Six Years," and reported near the bottom that bus ridership fell 4.9%, "resulting in an overall ridership decrease of 1.8%." The second, on July 14, was headlined "Metro Ridership in June Surges by 2 Million."
May carried 26,966,657 rides. June carried 26,265,480. The month that surged had 701,177 fewer people on it than the month that slipped.
Both releases are accurate. Neither headline is describing this year.
As quoted / in context
As quoted. "In June, Metro was in the center of the action as it provided 26,265,480 rides, 2 million more than last June, representing a 9% growth," the agency wrote. Rail did better still: "In June, ridership was 6,561,484, a 21.8% year-over-year increase." A month earlier, the same office had written that "rail ridership increased 9.5% compared to the same period last year."
In context. A year-over-year percentage contains two numbers and only one of them is current. Between the two releases, the current number barely moved. Rail carried 6,472,058 rides in May and 6,561,484 in June — a gain of 89,426, or 1.4% by our arithmetic. Over the same four weeks the published growth rate went from 9.5% to 21.8%. Nothing on the trains did that.
Last June did. The D Line spent the entire month closed: Metro shut the subway on May 17, 2025 and reopened it 70 days later, on July 26, to tie the existing tunnels into the new ones under Wilshire, as LAist reported at the time. And the closure was not the only thing thinning the platforms. LAist, reading the June 2025 numbers, named federal immigration enforcement and the related protests, a weeklong downtown curfew, the D Line shutdown and the end of the school year as the plausible causes of a roughly 6% drop. Streetsblog LA, working from the same agency statistics, reported that the drop snapped a 30-month growth streak and cited the Los Angeles Times' mid-June finding that ridership had fallen 10 to 15 percent during the raids.
That is the denominator. Twenty-one point eight percent is the distance between a subway line running and a subway line closed, measured across a month when a large share of the system's riders were avoiding public space.
What it excludes
- The World Cup buses, by Metro's own instruction. The June release states it plainly: "These numbers exclude ridership on the direct enhanced service routes to Los Angeles Stadium for World Cup fans attending the matches." Those shuttles were not small. LAist reported on June 23 that the $1.75 stadium shuttles had carried more than 100,000 rides across the first four matches in Inglewood, rising from 18,551 for the U.S.–Paraguay opener to more than 29,000 for Iran–Belgium. The World Cup is in the release as an explanation and out of the release as a number.
- Three-quarters of the riders. Bus carried 19,703,996 of June's 26,265,480 rides — 75%, by our division. The 21.8% figure that led the coverage describes the other quarter. Bus grew 6.8%; in May it had fallen 4.9%.
- Riders the D Line took from the 720. Metro's May release noted that the 720 bus "had a 6.5% decrease in year-over-year ridership, largely driven by the expansion of the D line which largely follows the same route along Wilshire Boulevard." Wilshire is now served by a subway and a bus running the same corridor. Neither release nets one against the other, and the 8,000 to 10,000 daily rides Metro attributes to the three new stations are presented as new.
- How much of the rail total those three stations are. Metro's own estimate, at 8,000 to 10,000 rides a day, works out to roughly 240,000 to 300,000 rides across a 30-day month — between 3.7% and 4.6% of June's rail figure, by our arithmetic on Metro's number. The extension is real and it is not what moved the percentage.
- Ten months. Both releases close with the same line: "The latest October 2025 customer experience survey showed that customer satisfaction has risen to 87 percent." It is the latest one. It is also from October.
One thing the release does not exclude, and deserves credit for: the D Line's own growth figure is measured against 2024. "The D line ridership is up more than 45% overall and 70% on Saturdays from June 2024," Metro wrote, and then, in a parenthesis, "(it was closed in June 2025 for work related to the extension.)" That is the only comparison in either document that steps over the broken year, and it is the most honest number in both.
The number underneath
There is a way to check the recovery that does not run through 2025 at all, because Metro publishes average weekday boardings and two of those figures are on the record.
In June 2024, the system averaged 939,615 weekday boardings — the figure Streetsblog read off Metro's ridership statistics page in its July 2025 write-up, against which June 2025's 877,008 was a 6.6% drop. In June 2026, Metro reports, "Weekday ridership was 953,820 which grew 8.4% from June 2025."
Set the two even years side by side and the two-year move is 14,205 weekday boardings. That is 1.5%.
In the twenty-four months between those two Junes, Metro opened the LAX/Metro Transit Center, opened three subway stations under Wilshire, and ran World Cup service to a stadium in Inglewood. The weekday system is about one and a half percent larger than it was before any of it. (A note on precision: Metro's 8.4% implies a June 2025 weekday base near 879,900, slightly above the 877,008 Streetsblog recorded last summer, and agencies revise. The two-year comparison does not depend on the middle year — both endpoints are published figures.)
Weekends are the genuinely good news, and they are the part no baseline trick can explain away. June Saturdays hit 708,826 boardings, up nearly 13%, and Metro notes that Saturday rail ridership in June came "nearly on par with rail weekday average ridership in June 2025." A transit system whose Saturday looks like its weekday is a system being used for something other than commuting, which is what the fare-capping change we covered this month was designed to reward.
The verdict
Nine percent is true. Twenty-one point eight percent is true. Both are measurements of the gap between June 2026 and a June that had a subway line switched off and immigration raids running through it, and neither release says so about the system-wide figures — the disclosure appears once, in a parenthesis, attached to the one line where the agency needed a different year to make the math work at all.
The honest sentence is duller and it is still a good one: two years after the last comparable June, with three new stations and an airport connection, Metro is carrying about 14,000 more weekday riders than it did before the disruption, and its weekends are meaningfully busier. That is a recovery plus a beginning. It is not a surge. Metro posted May's figures on June 15 and June's on July 14; on that cadence July's are close, and they will be the first month in more than a year measured against a baseline that was not broken.
Divide responsibly.
Comments 0