 ™
™
The 15 Best Places to Live in Los Angeles Right Now
We looked at cost, safety, walkability and transit. Then we ranked the places we’d actually want to live.
Most lists of the best places to live in Los Angeles are advertising with a headline on top. This one is an argument.
We looked at what places cost, how safe they are, how walkable they are, and whether you can leave without a car. Then we ranked the fifteen we’d actually want to live in.
Downtown isn’t on it. Neither is Long Beach. The full numbers for all nineteen places we measured are at the foot of the page.
1. Hancock Park
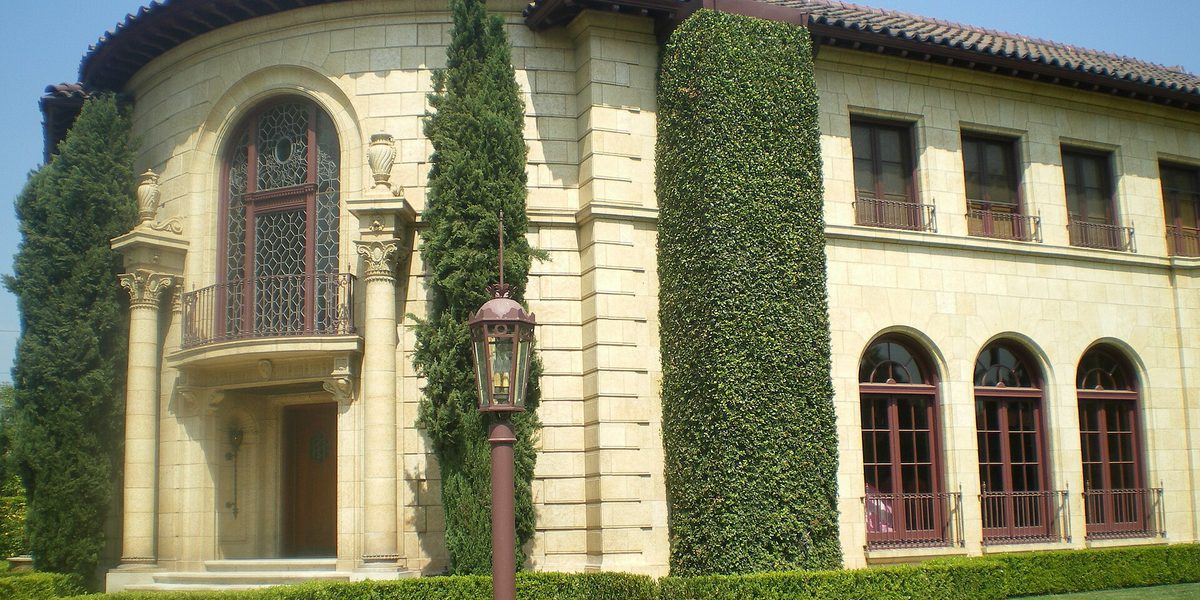
Hancock Park is the rare Los Angeles neighborhood that feels like it already has everything it wants. The streets are quiet, the houses are ridiculous, and Larchmont Boulevard, technically across the line in Windsor Square, works as its downtown anyway. Nobody getting coffee there cares which side of the boundary they’re standing on.
The market sets up on Larchmont twice a week, Sundays and Wednesdays, which is once more than most of this city manages. The Wilshire Country Club has been on the other side of the neighborhood for a century, and most Angelenos have never seen the inside of it.
There isn’t a clean rent number for Hancock Park, so we’re not going to fake one with ZIP 90004. The crime numbers are easier to read: violent crime is low, property crime isn’t. In practice the car deserves more worrying than the walk home.
What’s worth watching is Larchmont itself. Rite Aid closed in 2025 after 26 years and the newsstand next door went four days later, because the two leases were tied together. That’s not enough to kill a main street. But small losses count for more when the main street is only a few blocks long.
Pros
- A real main street on Larchmont
- Farmers market twice a week
- Violent crime among the lowest here
Cons
- Property crime is high, 41.10 per 1,000
- Nobody publishes what rent costs
2. Pasadena
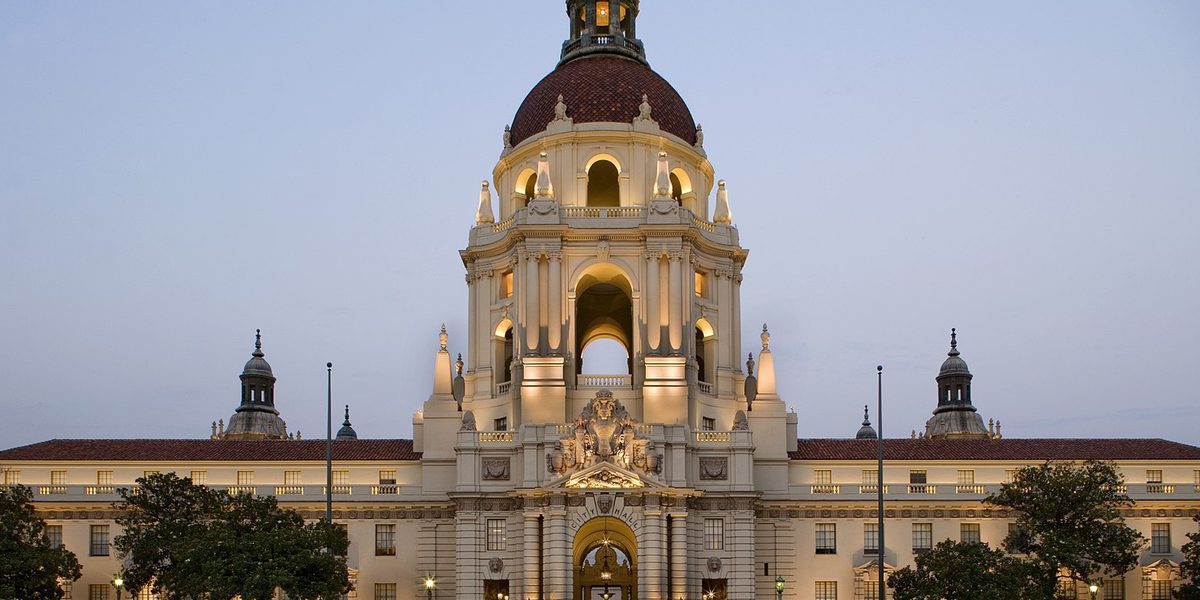
Pasadena is what people who hate Los Angeles think Los Angeles should have been.
It has a downtown that predates the freeway and never got knocked down for one. It has sidewalks people use, a train that goes somewhere, and enough of a tax base to keep its own libraries open. More than a quarter of the city lives within a half mile walk of a station, which is the highest share of anywhere near the top of this list.
Two farmers markets, on opposite sides of the week: Victory Park on Saturday mornings in front of the high school, Villa Parke on Tuesdays. Go see the Gamble House, which is the best argument anyone has made for wood. Eat at Pie ’n Burger, which has been doing one thing since 1963 and has never been talked into doing two.
The catch is that Pasadena is big, and only some of it works this way. Pick the wrong block and you get the train on paper and the car in practice.
Pros
- 27.2% of residents live near a train, best in the top tier
- Two farmers markets
- Half the property crime of Culver City
Cons
- Only parts of it are genuinely walkable
- $2,265 median rent
3. Culver City
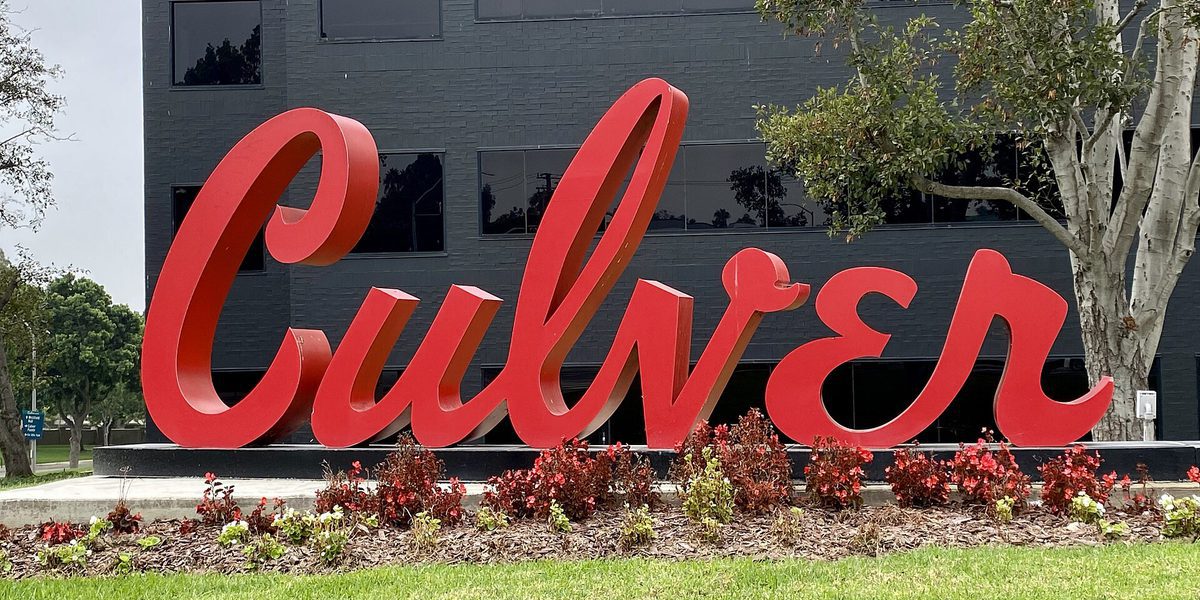
Culver City spent the last decade building the thing Angelenos keep claiming this city doesn’t have: an actual downtown, walkable end to end, with somewhere to sit.
The Culver Hotel has held the corner since 1924. Tito’s Tacos has been going since 1959 and Johnnie’s Pastrami since 1952, which in five square miles is a lot of continuous trading. The market runs Tuesday afternoons on Main Street.
The worry is that the new part keeps thinning out. Helms Bakery closed in December 2025, thirteen months after it reopened. Citizen Public Market, eight stalls and a rooftop bar, went dark that November, and its owners blamed parking and the city council on the way out. Two food halls in seven weeks is a pattern, not bad luck.
One thing outsiders get wrong: downtown Culver City isn’t really on the train. The E Line station is inside the city limits by about forty yards and a mile and a half from the part you want to walk around. It serves the Hayden Tract. It does not serve dinner.
The property crime rate here is the highest on this list, and most of it is shoplifting counted against 40,000 residents in a place that hosts several times that many people a day. Robbery, which doesn’t inflate that way, is lower than Glendale’s.
Pros
- A downtown that works end to end
- Three institutions past their 65th year
- Tuesday market on Main Street
Cons
- Highest property crime on this list, 47.10 per 1,000
- Only 9.6% live near the train
- $2,737, second highest rent here
4. Echo Park
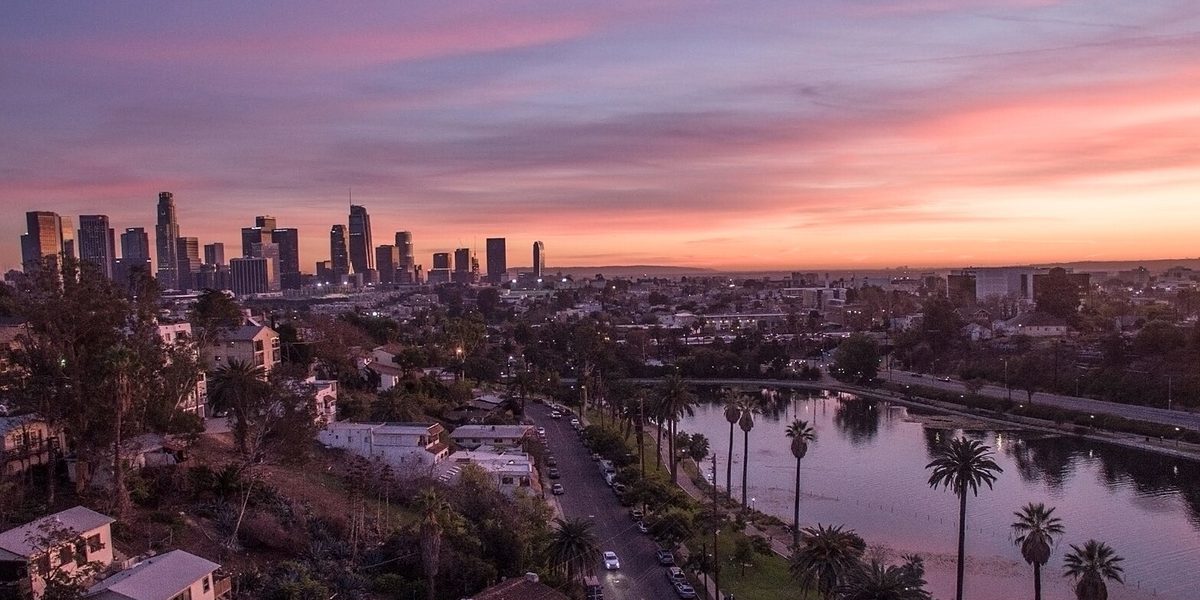
Echo Park is the closest thing this city has to a neighborhood you can spend a whole Saturday in without starting the car. The lake is the middle of it, the hills are the edge of it, and the streets in between are walkable in a way most of Los Angeles gave up on decades ago.
Taix closed in March after nearly a century on Sunset, and the way it went explains Echo Park better than any number could.
There was a preservation fight in 2021, and preservation sort of won. What got protected was the restaurant’s fixtures and the property, not the building. So the building came down, the fixtures go into whatever replaces it, and the owners say they will reopen by 2030. Echo Park fights, half wins, and gets the thing back as a feature of something newer.
It has no train, which on paper should sink it. It doesn’t, because Echo Park is one of the few places here where people walk out of preference rather than principle. About one household in nine owns no car. The lake has been there since 1868 and is most of the reason. The Angelus Temple has been staring across at it since 1923, and Pizza Buona has been on Sunset since 1958. The market is Friday afternoons on Logan.
It’s also the cheapest place in the top four by a wide margin, and violent crime here is higher than anywhere above it. Both of those are why people move in.
Pros
- $1,929, the cheapest in the top four
- One household in nine owns no car
- The lake, and the walk around it
Cons
- No rail anywhere in the neighborhood
- Violent crime higher than anywhere above it
5. Koreatown
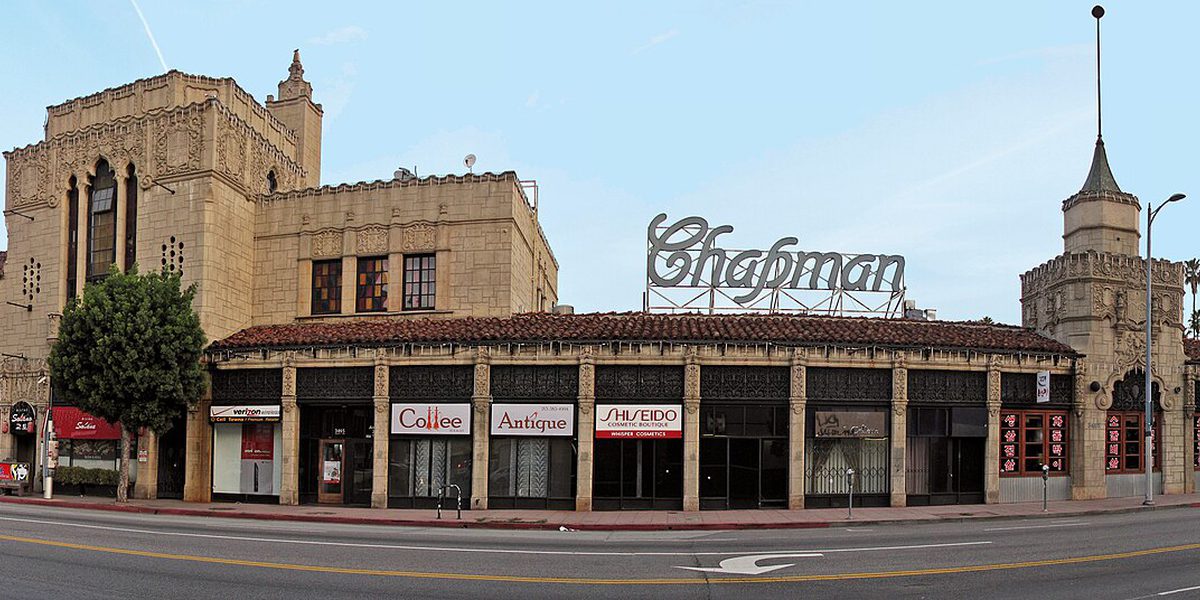
Koreatown never really closes. It’s the one part of Los Angeles where the city keeps going after eleven, where dinner at midnight isn’t an occasion, and where you can get home afterward without a car.
Three subway stations sit inside the neighborhood, close enough to actually use rather than close enough to put on a listing. It’s also the densest place on this list by a distance and the second cheapest, which is not a combination Los Angeles offers often.
The Wiltern still works as a concert hall at Wilshire and Western, ninety years in. Taylor’s Steakhouse has been on Eighth since 1953. You can get a steak at midnight here and a train home afterward, which most of this city cannot manage at either end.
The cost is real. Violent crime is near the top of the range, driven by robberies and assaults in a place where far more people are out at night than live there. It’s the reason Koreatown sits fifth instead of first, and it’s the call on this list most worth arguing about.
Pros
- 24.4% of households own no car, the highest anywhere here
- 80.2% live within a half mile of rail
- $1,715, second cheapest
Cons
- Violent crime 7.04 per 1,000, second highest
- The densest place on this list, and it feels it
6. Santa Monica
Most walkable places in Los Angeles have one good part. Santa Monica is walkable most of the way through, which is rarer and much harder to fake.
That’s the case for living there rather than visiting. The Promenade and the beach are what everyone else comes for; residents get a city where the errands are on foot no matter which side of it they picked. Three trains run into it.
The Pier has been there since 1909. The Galley has been on Main Street since 1934, which makes it the oldest restaurant in town by its own count and a useful reminder that Santa Monica existed before it was a destination.
Property crime looks alarming and mostly isn’t, in the specific sense that the thefts are counted against 94,000 residents in a city that hosts many times that on a summer Saturday. It fell sharply last year. Rent did not.
Pros
- Walkable across the whole city, not one good core
- Three E Line stations
- The beach, obviously
Cons
- Property crime 38.85 per 1,000, third highest
- $2,402 median rent
7. Manhattan Beach
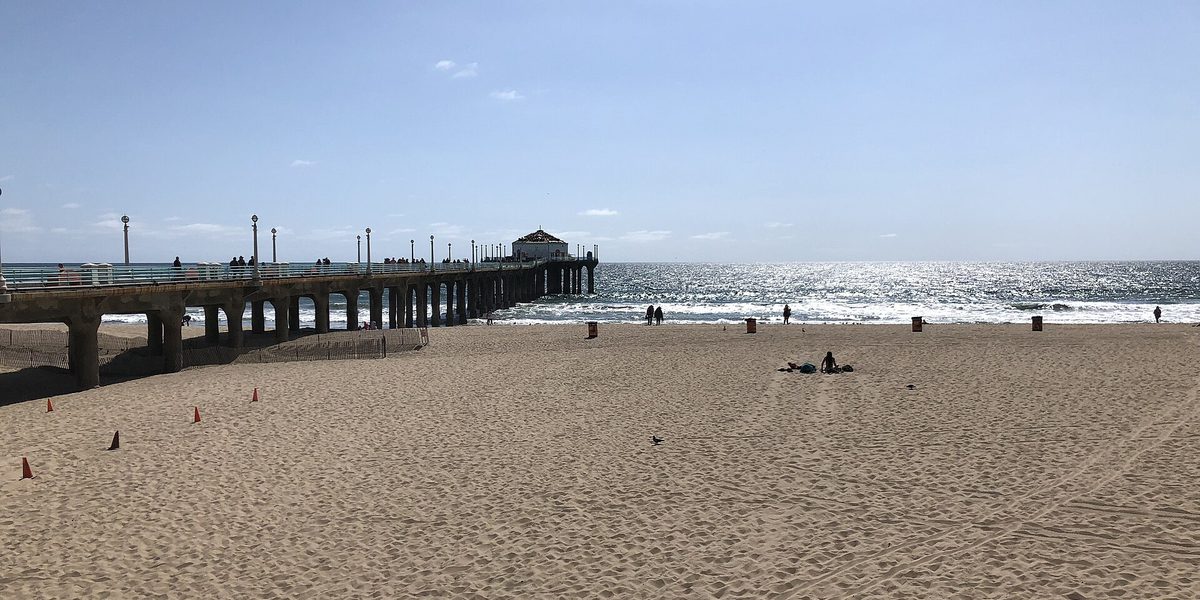
You are buying the beach and the quiet, and you will pay for both.
Manhattan Beach has the lowest violent crime rate of anywhere on this list and the highest rent by several hundred dollars a month. It has no train and no realistic prospect of one. Almost nobody here lives without a car, which is less a failure of transit than a description of what the town is for.
The pier is a state landmark, finished in 1920, and the Roundhouse Aquarium at the end of it has been teaching kids since 1979 and still charges nothing. Breakfast is Uncle Bill’s Pancake House on Highland, opened in 1961 and still run by the family that bought it from the man who started it.
Two things people repeat that aren’t quite right. It isn’t the safest place in the region once you count property crime. And it scores well on walkability mostly because the grid is tidy, which is not the same as having somewhere to walk to.
Pros
- Lowest violent crime rate on this list, 1.16 per 1,000
- Zero homicides in 2025
- A free aquarium at the end of the pier
Cons
- $3,449, the highest rent here by $712
- No rail, and no realistic prospect of any
- 2.2% car free, the lowest share on the list
8. Highland Park
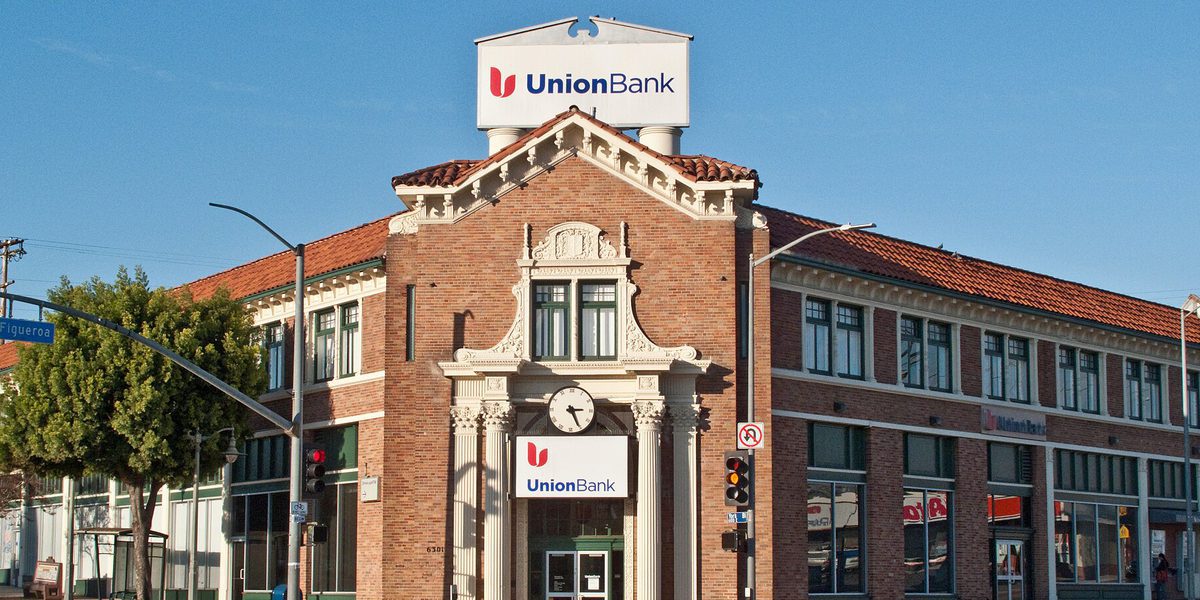
Highland Park has the two things that almost never turn up together in this city: a walkable strip people actually walk, and a train that goes somewhere worth going.
Two stations sit inside it, and since the Foothill extension one of them is a single ride out to Pomona or straight into downtown. The walkability data everyone quotes was collected before any of that, so it scores the place lower than it now deserves.
What it does have, on the record, is the lowest property crime rate of anywhere we measured, and it isn’t close: fewer than sixty burglaries across a neighborhood of fifty thousand people.
Go bowling at Highland Park Bowl on Figueroa, open since 1927 and the oldest alley in the city. Then walk to Galco’s on York, a grocery that has been in Highland Park since 1955, sells bottled soda by the wall, is not a restaurant, and has no interest in becoming one.
For what you get, nothing else on this list is priced like it.
Pros
- Lowest property crime of all fifteen, 11.85 per 1,000
- Two A Line stations, one seat to downtown
- $1,913 for all of it
Cons
- Only about a third of residents live near the train
- The walkability data predates the new service
9. West Adams
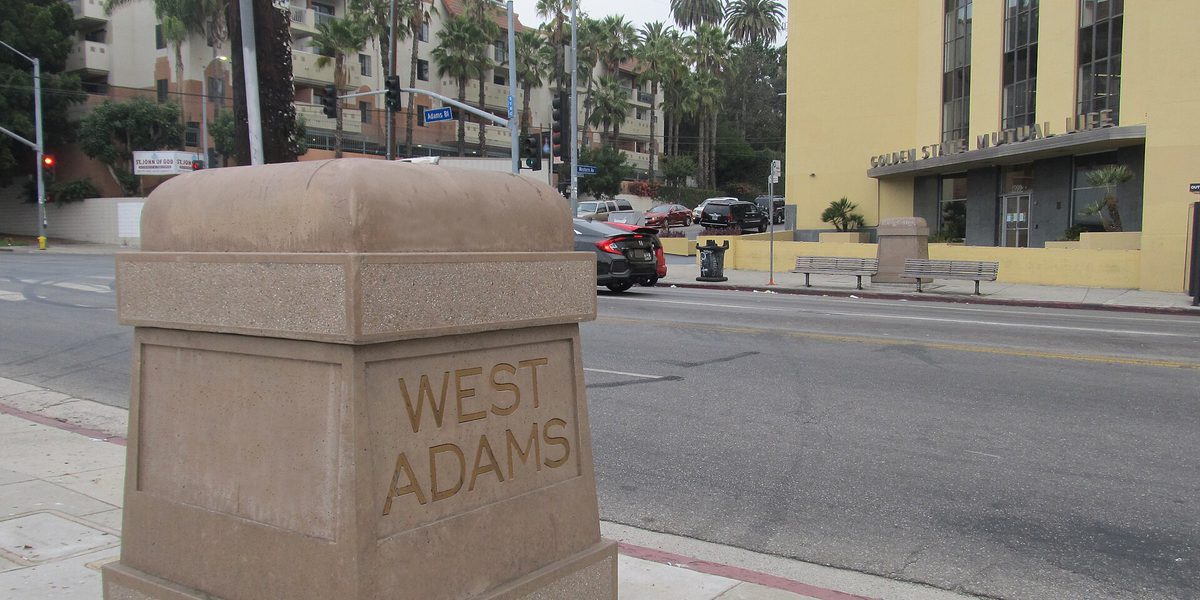
The housing stock in West Adams is some of the best in Los Angeles, and it has been there for a hundred years waiting for the rest of the city to notice.
It is now the most walkable place we measured, with the shortest average walk to transit of anywhere on this list, because the E Line runs along its southern edge. Almost every resident is within a mile of a train.
The rent figure is where it gets complicated. West Adams still reads as one of the cheapest places here, and new units in the same ZIP are asking nearly eighty percent more than the households already living there pay. Both numbers are accurate. They describe two different West Adamses, and the gap between them is the whole story of the neighborhood right now.
The William Andrews Clark Memorial Library sits on five landscaped acres of Cimarron Street, a 1926 building that belongs to UCLA and requires an appointment, which is worth the trouble. Harold and Belle’s has been serving Creole on West Jefferson since 1969.
Pros
- The best walkability score measured here, 16.51
- Shortest average walk to transit of anywhere on the list
- $1,815 median rent
Cons
- Violent crime 5.32 per 1,000, sixth highest
- New units asking nearly 80% more than sitting tenants pay
10. Los Feliz
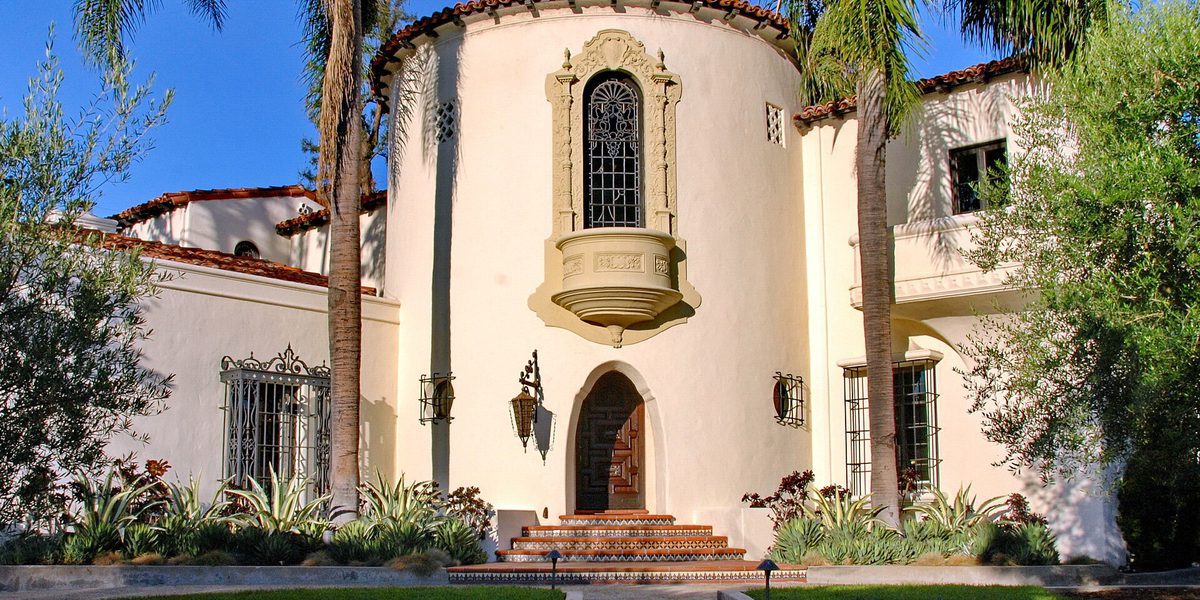
Los Feliz sits at the foot of Griffith Park, which means most of the neighborhood lives ten minutes from four thousand acres of hillside and never has to drive to get to it.
Los Feliz doesn’t have a train station and has better access to the subway than several places that do.
Vermont and Sunset is close enough that most of the neighborhood can walk to it, which puts Los Feliz ahead of Culver City and Studio City on the measure that actually matters, despite both of them having platforms inside their own boundaries. Crime is quiet here in both directions.
Drink at the Dresden, family owned on North Vermont since 1954. Walk up Olive Hill to Hollyhock House, Frank Lloyd Wright’s 1921 house and the first UNESCO World Heritage Site in Los Angeles. Griffith Observatory is up the hill and free, and while it’s technically in Griffith Park rather than the neighborhood, Los Feliz gets the road up to it, which is most of the pleasure anyway.
One correction worth making, since it gets quoted: Los Feliz is more expensive than the rent figure here suggests. The ZIP it shares stretches into East Hollywood and pulls the number down.
Pros
- Griffith Park at the top of the street
- Better subway access than places with their own station
- Violent crime 2.39 per 1,000
Cons
- No station of its own
- Genuinely pricier than the shared ZIP figure suggests
11. Eagle Rock
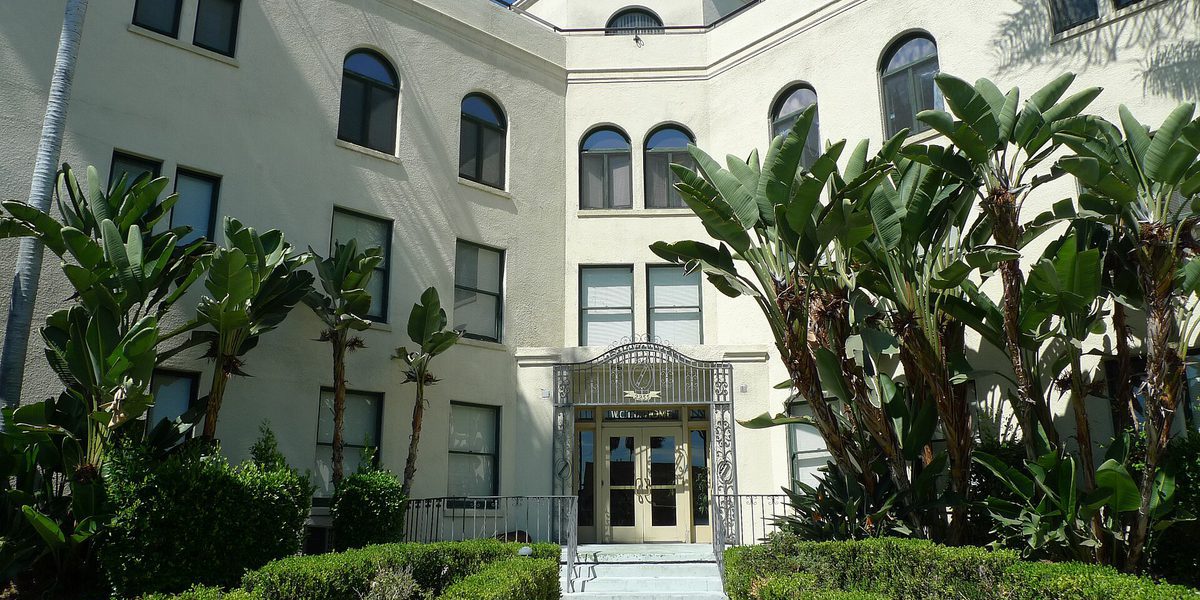
Eagle Rock is a small town that happens to be inside Los Angeles, and it charges the usual small town tax: you will drive.
There is no station in Eagle Rock and no resident within a mile of one, which is the single reason it sits here rather than five places higher. Everything else about it is good. Property crime is among the lowest anywhere on this list and rent is among the cheapest, a combination that mostly does not exist in this county.
It is named after a rock, a sandstone dome above the 134 at the top of Figueroa, which the city made Historic Cultural Monument No. 10 in 1962. Number ten. That tells you how seriously the place takes itself, and it is not wrong to.
Eat at Casa Bianca, opened by the Martorana family on Colorado Boulevard in 1955 and run by them ever since.
Pros
- Property crime 14.59 per 1,000, third lowest
- $1,808, third cheapest here
- Its own small town center
Cons
- No rail at all, nearest platform nearly two miles off
- Two homicides in 2025
12. Mar Vista
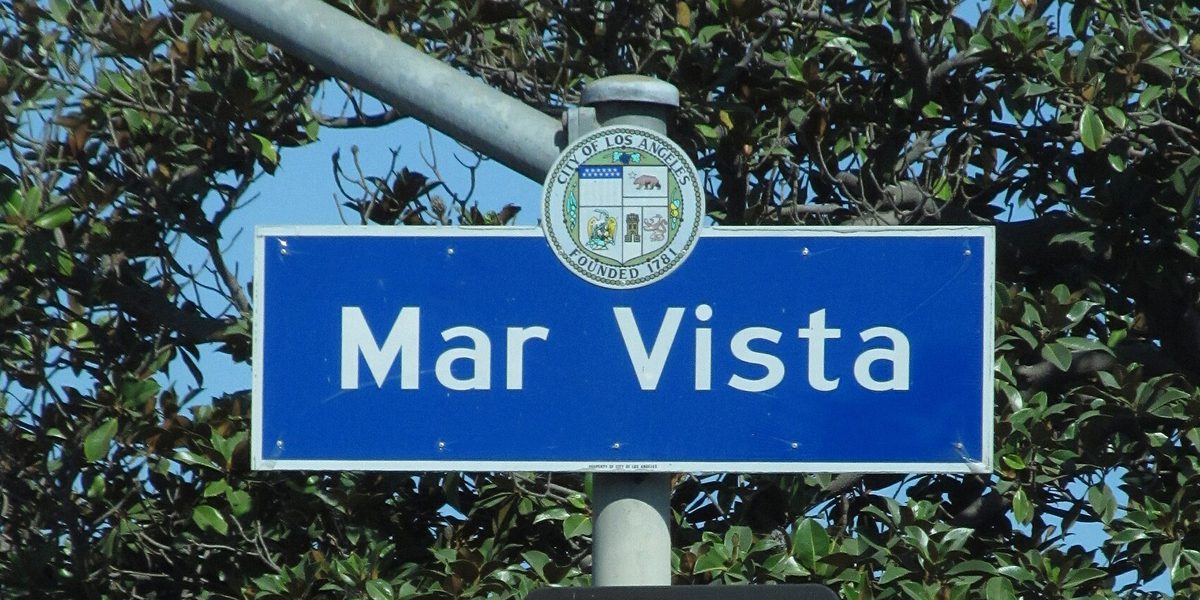
Mar Vista is easy to love until you have somewhere to be.
It is genuinely, unusually safe, and unlike most of the safe places on this list that isn’t a statistical trick. There’s no tourist strip or shopping district inflating the numbers with other people’s problems. What the data says about Mar Vista is roughly what a resident would tell you.
The farmers market on Grand View has been going since 2006. Walk the Gregory Ain tract on Beethoven and Moore, a 1948 experiment in modernist housing that became the city’s first modern historic district, and remember it’s a residential street, so look and keep moving.
We’re not naming a restaurant here. The famous ones people associate with Mar Vista turn out to sit over the line in Del Rey or Culver City, and the ones inside the boundary have mostly closed. That’s a real description of the place: pleasant, quiet, and slightly short of its own center of gravity.
No train, either. Not one resident within a half mile of a station.
Pros
- Second lowest violent and property crime on the list
- No visitor district inflating those numbers
- Farmers market going since 2006
Cons
- No rail, and not one resident within a half mile of a station
- $2,279, and no real center of its own
13. Glendale
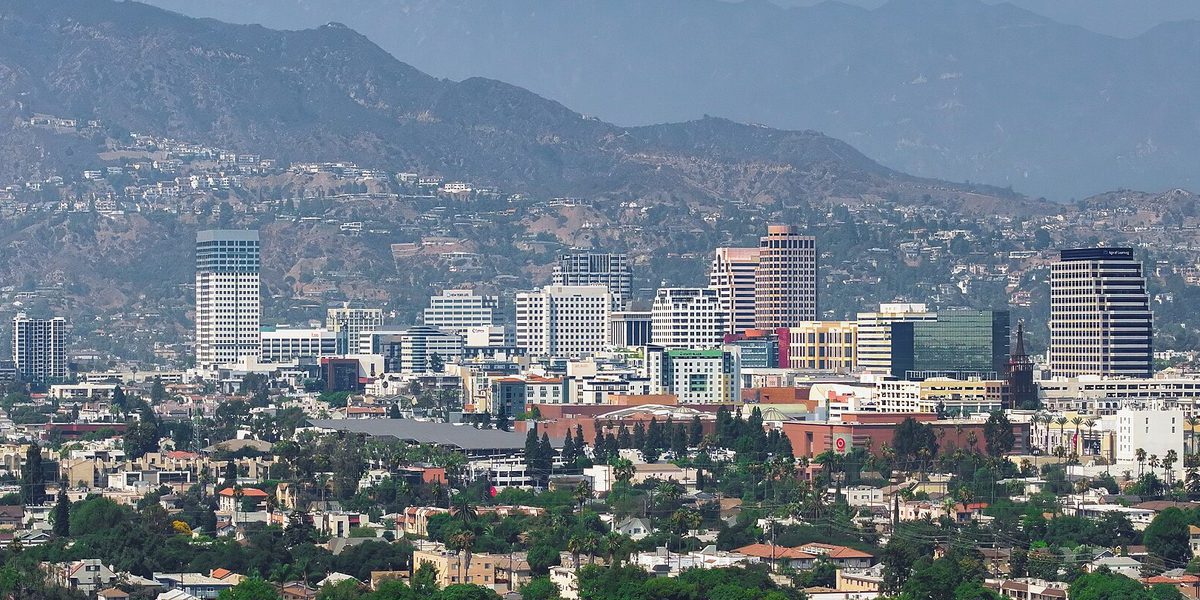
Brand Boulevard is the argument for Glendale: a 1925 theater the city owns, a steakhouse that has been feeding the same families since 1937, and enough people on the sidewalk on a weeknight to embarrass most of Los Angeles.
Glendale scores last on that index, which is an average taken across a city that includes a mountain range. The half mile around Brand and Broadway scores far higher, and anyone who has stood there knows which number is describing the place. Twelve percent of Glendale households own no car, more than in Santa Monica or Pasadena, and residents tend to be a better guide than models.
The Alex Theatre has been at 216 North Brand since 1925 and the city owns it. Damon’s has been a Glendale steakhouse since 1937. Up in the hills, Brand Library is a 1904 mansion that has been lending art and music books since 1956.
It’s also a big, quiet, safe city with almost 200,000 people in it and the lowest crime of any jurisdiction this size on the list. What it doesn’t have is Metro rail, and the nearest station is a long way off in Highland Park.
Pros
- Violent crime 2.24 per 1,000, third lowest here
- 12% of households own no car
- Brand Boulevard after dark
Cons
- No Metro rail, nearest station is a long drive
- Walkability scores badly because the city includes a mountain range
14. South Pasadena
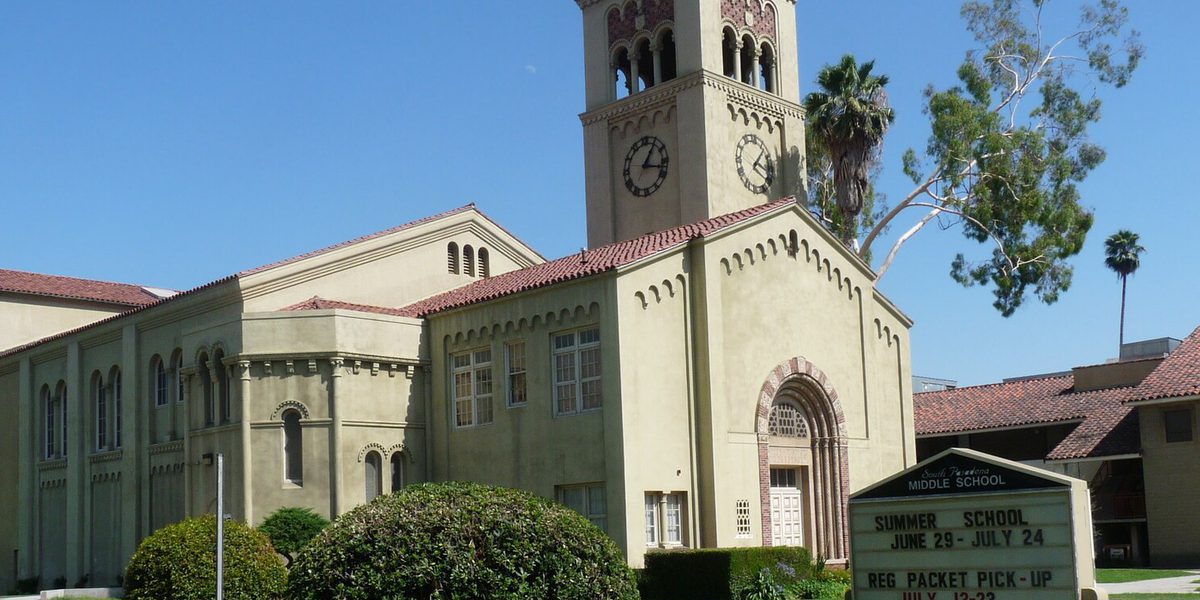
People move to South Pasadena for the schools and stay for the quiet, and they pay for both.
It’s small, about 26,000 people, with its own everything and a train station in the middle of it. A quarter of residents live within a walk of that station, though almost everyone still owns a car, which tells you the train is a commute here rather than a way of organizing a life.
The Fair Oaks Pharmacy on Mission Street has had a soda fountain in it since 1915 and still fills prescriptions. The Rialto has stood on Fair Oaks since 1925, though it stopped showing films some time ago, so admire it from the sidewalk. The farmers market has run beside the station since 1999, which is the closest thing on this list to a picture of what transit is actually for.
Crime here is very low, on a base so small that a handful of incidents would move it noticeably. Read it as reassuring rather than precise.
Pros
- 25.7% live within a half mile of the A Line
- Violent crime 2.76 per 1,000
- A soda fountain that has been pouring since 1915
Cons
- $2,284, fifth highest rent here
- 3.3% car free, second lowest on the list
15. Leimert Park
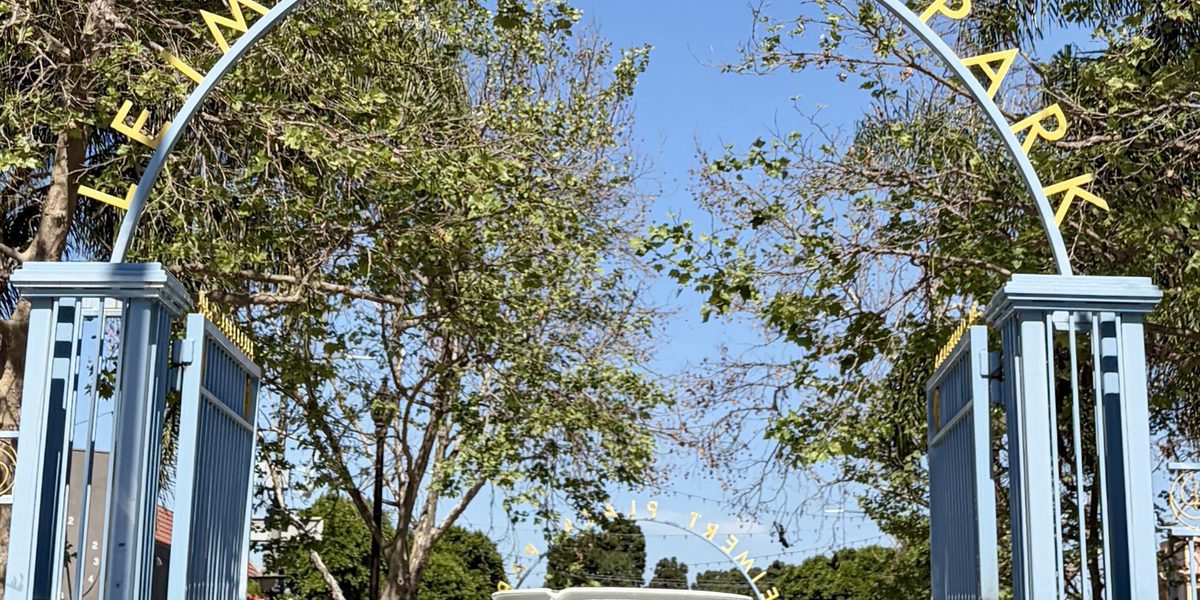
Leimert Park has been the cultural center of Black Los Angeles for seventy years. The Village is a few square blocks around a park, with a jazz institution on one corner and a 1931 theater coming back to life on another.
Leimert Plaza Park is the middle of it. The World Stage has been running performances and workshops off the plaza since 1989. The Vision Theatre, built by Howard Hughes in 1931 and later owned by Marla Gibbs, is coming back after fifteen years of city renovation.
It has the lowest rent anywhere on this list and three stations inside a neighborhood barely a mile across. The K Line opened after the transit data everyone cites was collected, so every ranking of this place is working from a version of it that no longer exists.
The violent crime rate here is the highest we measured, and it deserves a straight answer rather than a footnote. It rests on 162 offenses among 13,400 residents. Burglary is lower here than in twelve of the seventeen other places on this list, and most of the theft is concentrated on the Crenshaw commercial corridor, counted against people who live nearby rather than the people it happened to.
Fifteenth is where the numbers put it. It is not where the neighborhood belongs, and that gap is worth saying out loud once.
Pros
- $1,612, the lowest rent anywhere on this list
- Three stations inside a neighborhood barely a mile across
- The World Stage, and the Vision Theatre reopening
Cons
- Violent crime 12.06 per 1,000, the highest measured
- A small population makes that rate move sharply
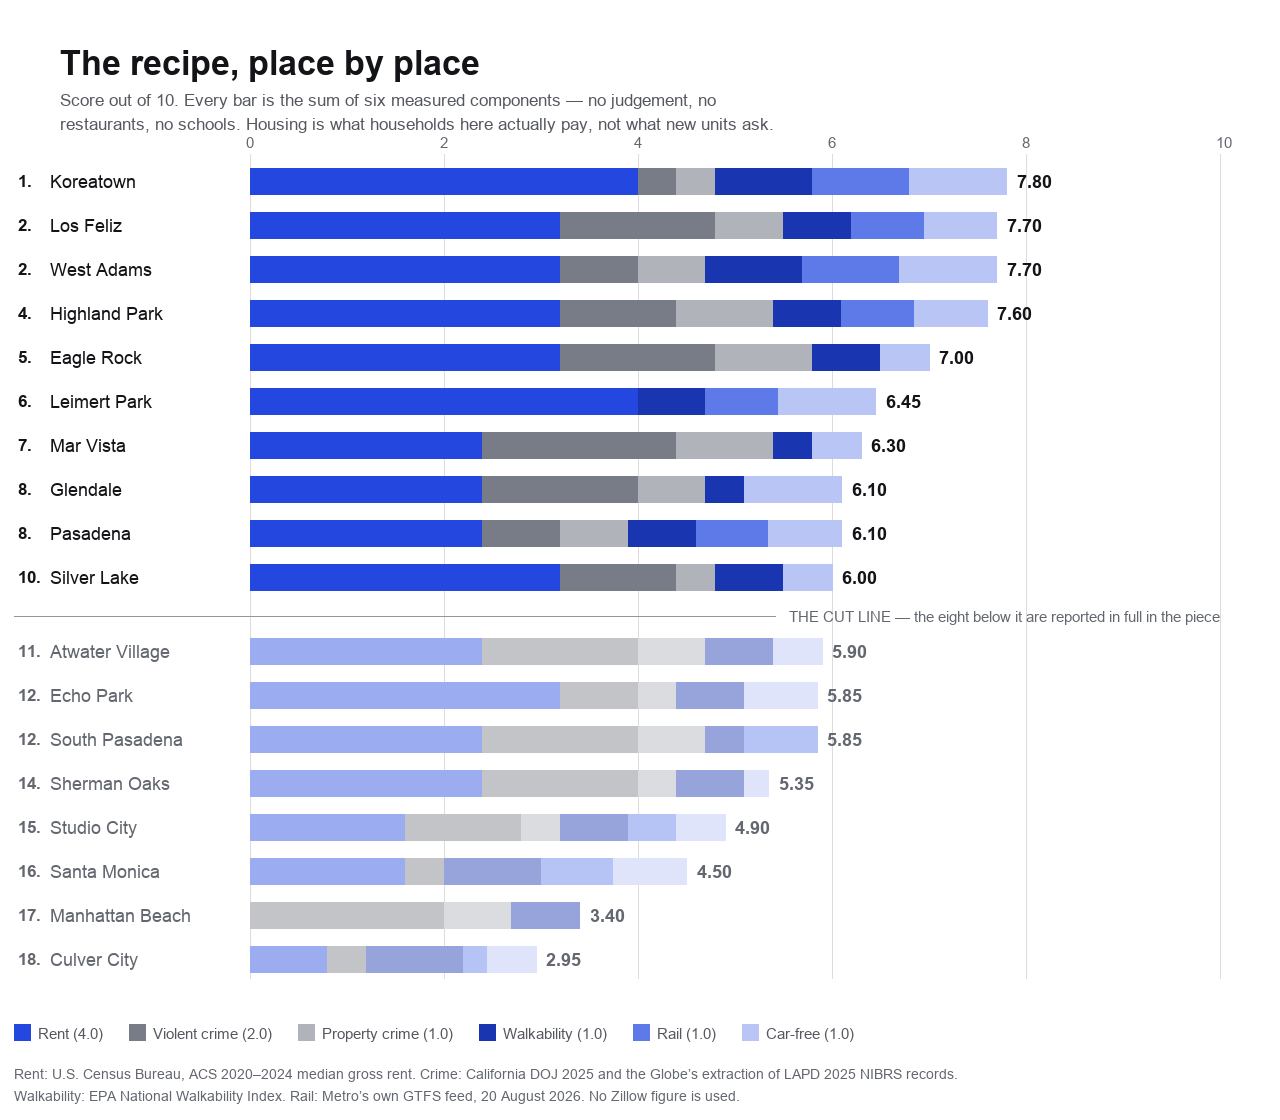
The fifteen, in one line each
The whole list, now that you have the arguments.
- Hancock Park. Quiet streets, ridiculous houses, and a main street that technically belongs to the neighborhood next door.
- Pasadena. What people who hate Los Angeles think Los Angeles should have been.
- Culver City. Built itself a real downtown, and now has to keep from hollowing it out.
- Echo Park. No train, and people walk anyway. Work that out and you understand the place.
- Koreatown. The easiest place in the city to build a life without a car, and the hardest call on this list.
- Santa Monica. Walkable most of the way through, not just in the part visitors see.
- Manhattan Beach. You’re buying the beach and the quiet, and you’ll pay for both.
- Highland Park. The train changed it and the data hasn’t caught up.
- West Adams. Some of the best housing in the city, and new rents that tell you who it’s for now.
- Los Feliz. No station of its own, and better subway access than places that have one.
- Eagle Rock. A small town inside Los Angeles, with the driving that implies.
- Mar Vista. Easy to love until you have somewhere to be.
- Glendale. A real downtown that no walkability index has ever understood.
- South Pasadena. Small, quiet, expensive, and the train is a commute rather than a way of life.
- Leimert Park. The cultural center of Black Los Angeles, and almost none of it shows up in a spreadsheet.
Where the numbers argue with the order
Five of the fifteen sit higher than their own evidence supports, and one sits lower. Putting them in one block is not a retraction. It is the difference between a list you can argue with and a list that hopes you will not.
- Hancock Park at 1. No published rent figure at all, a property rate of 41.10 per 1,000 that is third-worst of the twenty places examined, and a car-free share lower than every place here but two.
- Culver City at 3. The highest property-crime rate of the eighteen measured, and the second-highest rent behind Manhattan Beach.
- Echo Park at 4. The fifth-highest violent rate of the eighteen, and not one resident inside half a mile of a train.
- Santa Monica at 6. The third-highest property rate of the eighteen, on a numerator stuffed with people who do not live there.
- Manhattan Beach at 7. The highest rent in the set by $712, and 2.2 percent of households owning no car, the lowest share of all eighteen, against the lowest violent rate of all eighteen.
- And the other way, Koreatown at 5. First of the eighteen on car-free households and first on rail coverage, second-cheapest, denser than anywhere else here. The numbers want it higher. The violent rate is why it is not.
How this was built, and what it can’t tell you
The order is an editor’s judgment. The numbers are not. Six things were measured for every place, from public-domain federal and state sources: median gross rent and the share of households owning no car, both from the Census Bureau’s American Community Survey 2020–2024 five-year estimates; violent and property offenses per 1,000 residents for calendar 2025, from the California Department of Justice for the six incorporated cities and from the Globe’s own extraction and geocoding of LAPD NIBRS records for the twelve neighborhoods; the EPA National Walkability Index at block-group level, which scores street form and 2020-vintage transit proximity out of 20; and the share of residents within half a mile of a Metro rail station, computed here from Metro’s published schedule feed.
Each entry above prints two or three of those six, the ones that actually carry that place. That is deliberate. Fifteen places measured on six identical axes is a spreadsheet, and a spreadsheet is not an argument. Everything not printed is still held, still sourced and still re-checked on the same clock, in the claims file this page is graded against; nothing was dropped, only de-emphasised.
Landmarks and places to eat were reported, not scored. There is no free, licensable index of restaurant quality at this geography, and a count of Michelin recognitions would tell you where the tasting menus are rather than whether you can eat well near your door. So every venue named on this page was looked up and checked one at a time, and where a place could not be verified to this paper’s satisfaction, the entry names nothing and says what it can stand behind instead.
Three things to hold against the list. Six of these places are whole cities and twelve are neighborhoods, which is not a fair comparison and could not be made one. Every neighborhood rent figure is a ZIP-code figure wearing a neighborhood’s name, because nobody publishes rent by neighborhood. And crime counted per resident overstates the risk badly wherever a shopping district sits inside the line.
The one number that isn’t here
There is no Zillow figure anywhere in this piece, and that is a deliberate hole worth knowing about.
The obvious way to measure housing cost in Los Angeles is asking rent, what a new listing wants, and the standard source for it is Zillow’s Observed Rent Index. We pulled it. We did not publish it. Zillow’s terms-of-use page returned an HTTP 403 to every automated read on the day this was reported, so nobody at this paper has established that we may republish its figures, and being unable to read a license is not permission to ignore one. Every Zillow number stays out until a human opens that page and reads it.
So the money figure here is the Census Bureau’s median gross rent, which is a different measurement rather than a substitute. Asking rent is what a newcomer will face. Median gross rent is what the households already there pay, utilities included, averaged over five years in 2024 dollars. In a city where the Rent Stabilization Ordinance covers most multifamily built before October 1978, those two numbers describe two different populations, and the gap between them is the most important fact about the Los Angeles housing market. West Adams is where that gap stops being academic: ZIP 90016’s median gross rent is $1,815, fourth-lowest of the eighteen measured, while new units in the same ZIP were asking 78 percent more. Both numbers are true. They describe two different West Adamses, and the distance between them has a name, and the name is displacement.
The soft spots, where one line on a map moves a number
A list that hides its soft spots is not worth reading. These are ours.
- West Adams, ZIP 90016 against 90018. $1,815 against $1,509, the eastern half, toward Jefferson Park, is 17 percent cheaper, and the Times polygon is 1.48 square miles, far smaller than the district most listings mean. Both figures are printed because we cannot tell you which line is right.
- Santa Monica sits two dollars from a round number. Its $2,402 carries a Census margin of error of ±$88, so the true figure is anywhere between $2,314 and $2,490.
- Koreatown on 90010 instead of 90005. Median gross rent there is $2,603 rather than $1,715. Koreatown spans four ZIPs, 90005 matches its residential core, and 90010 is also the thinnest sampled.
- Echo Park and Silver Lake share 90026. Silver Lake also spans 90039, and the two differ by 17 percent on median gross rent: $1,929 against $2,250. Neither is a Silver Lake figure, which is most of why Silver Lake is not on this list.
- Studio City is inside its own error. Its $2,535 carries a margin of ±$163, and scoring it on ZIP 91602 instead of 91604 gives $2,246.
- Sherman Oaks on 91403 instead of 91423. $2,417 instead of $2,277. ZIP 91436 was excluded on purpose: it is mostly Encino, and folding it in would inflate a Sherman Oaks figure past recognition.
Measured, and left off
Silver Lake is the painful one, and the reason is bureaucratic rather than aesthetic: it has no ZIP code of its own. It is split between 90026, which it shares with Echo Park, and 90039, which it shares with Atwater Village, and on median gross rent those two differ by 17 percent. Neither is a Silver Lake figure. It also runs a property rate of 32.87 per 1,000, fourth-worst of the eighteen, on 689 larcenies and 161 vehicle thefts against 30,484 residents.
Atwater Village has the fourth-lowest violent rate of the eighteen at 2.28 and no Metro rail within half a mile of anybody. The trouble is the size of the evidence rather than the evidence: the whole crime file rests on 26 offenses. A rate built on 26 events is a number, not a finding.
Sherman Oaks at $2,277 and Studio City at $2,535 are the seventh- and third-most expensive places measured here, both post property rates in the high twenties: 27.32 and 29.94 per 1,000, and neither has rail worth the word, Studio City’s one station, Universal/Studio City, is across the 101 from Ventura Boulevard. Their violent rates are genuinely low. It was not enough.
And a place nobody can measure at all: Larchmont Village, which has the same no-publisher problem as Hancock Park and, at 0.48 square miles, an eleven-offense crime file that three more incidents would move by a quarter. Hancock Park is ranked anyway because the editor put it there and the rest of its record can be established. Larchmont could not clear even that bar.
Sixteen things this data does not say
The caveats that would embarrass us if a reader found them before we printed them.
- Median gross rent is not asking rent. It is what current tenants pay, utilities included, averaged over five years and expressed in 2024 dollars. A newcomer signing a lease this month will pay more, in some places far more.
- Never subtract one from the other and call it rent growth. The gap between a five-year average and a current listing is mostly definitional.
- ZIP codes are not neighborhoods, and three pairs collide. Echo Park and southern Silver Lake are both 90026. Atwater Village and northern Silver Lake are both 90039. Hancock Park and Larchmont are both 90004. Where two places print the same rent, the reason is the post office.
- HUD's fair market rents are not market rents and are not printed here. They are 40th-percentile gross rents set administratively to price housing vouchers.
- The eighteen measured places are not measured on the same instrument. Six are whole incorporated cities reporting summary UCR to the California Department of Justice; twelve are Los Angeles Times neighborhood polygons where we extracted and geocoded LAPD's 2025 NIBRS records ourselves.
- Our neighborhood method runs about 7.1 percent low on violent crime: 24,022 offenses against 25,862 citywide, essentially all of it in aggravated assault, because California's summary definition captures cases NIBRS codes as simple assault. Do not read a 0.3-per-1,000 gap between a neighborhood and a city as real.
- The denominators are different vintages: 2020 Census for neighborhoods, Department of Finance January 2025 for cities. The City of Los Angeles fell 1.5 percent between those dates, so neighborhood rates run slightly high.
- These are crimes per resident, not risk to a resident. In six places: Culver City, Santa Monica, Leimert Park, Hancock Park, Larchmont and Koreatown, a large commercial, retail, transit or visitor district sits in the numerator while only residents sit in the denominator. We could not correct it; daytime-population data does not exist on these boundaries.
- Small counts are not stable rates. Larchmont's rests on 11 offenses, Atwater Village's on 26, Manhattan Beach's on 40, Hancock Park's on 46, South Pasadena's on 73. Never write that one of them is safer than another.
- There is no trend column and we could not build one. LAPD's 2024 records are an artifact of a March 2024 system cutover: 43,242 geocoded records for 2024 against 110,434 for 2025. Six cities have a usable 2024. Twelve neighborhoods do not. A trend column would have been real for six places and fabricated for twelve.
- The EPA walkability index does not know about any transit built since 2020, and transit is a third of it. The K Line, the Regional Connector, the A Line's Foothill extension and the D Line extension to Wilshire/La Brea, which opened 8 May 2026, are all invisible to it. Leimert Park, Highland Park and Hancock Park are all scored lower than they should be.
- A whole-city average is not a neighborhood. Pasadena's 14.62 spans 59.5 square kilometers and runs from 1.00 to 19.83. Glendale's 13.41 spans 78.9.
- The index measures street form, not whether the walk is any good. Nothing in it captures sidewalk condition, shade, slope, lighting, traffic speed or whether there is a grocery store at the end. Where the index and the car-free share disagree, the car-free share is observed behavior and the index is a model, and the car-free share reflects low incomes as well as good transit.
- Containing a station is not being served by one. Eight of our in-boundary stations sit within 100 meters of a border. Culver City Station is 2.7 kilometers from downtown Culver City. Universal/Studio City is across the 101 from Ventura Boulevard. Los Feliz contains no station and has better rail coverage than three places that do. Rail figures are our own computation from Metro's published schedule feed, pulled 20 August 2026; Metro is the provider of that information and is not responsible for what we did with it.
- Reported crime is reported crime. It measures what residents call the police about and what the police then record. Reporting rates differ by income, insurance, immigration status and trust in the department. A low number can mean a safe place or a place that does not call, and this data cannot tell them apart, which matters most in a list that will be read as a verdict on neighborhoods with very different relationships to the LAPD.
- Nothing here measures schools, air quality, heat, tree canopy, flood or fire risk, park access, or pedestrian injury. Several of them would change this order completely, and the editor would still own it.
What happens to this page next
This list does not get replaced. It lives at one address and gets updated in place, with the date of its last real check printed on it. Rent moves fastest, so the sources are re-fetched quarterly; the crime data is annual and the walkability index has not been republished since 2021, so those are re-checked by hand on their own clocks. If a source moves, the page changes and the date changes with it. If a source cannot be reached, nothing changes and nothing is re-dated, an unread source is not a check.
Revised 21 August 2026. The order became the editor’s, the score out of ten that used to sit on every entry came off, each entry kept only the figures that carry it, and the landmarks and the places to eat were reported and added. Every number here is the same number it was, from the same source, as of the same date.
Comments 0